5.2 Seeing
Learning Objectives
- Identify the key structures of the eye and the role they play in vision.
- Summarize how the eye and the visual cortex work together to sense and perceive the visual stimuli in the environment, including processing colours, shape, depth, and motion.
Whereas other animals rely primarily on hearing, smell, or touch to understand the world around them, human beings rely in large part on vision. A significant part of our cerebral cortex is devoted to seeing, and we have substantial visual skills. Seeing begins when light falls on the eyes, initiating the process of transduction. Once this visual information reaches the visual cortex, it is processed by a variety of neurons that detect colours, shapes, and motion, and that create meaningful perceptions out of the incoming stimuli.
The air around us is filled with a sea of electromagnetic energy: pulses of energy waves that can carry information from place to place. Electromagnetic waves vary in their wavelength — which is the distance between one wave peak and the next wave peak — with the shortest gamma waves being only a fraction of a millimetre in length and the longest radio waves being hundreds of kilometres long. Humans are blind to almost all of this energy. Our eyes detect only the range from about 400 to 700 billionths of a metre; as such, this part of the electromagnetic spectrum is known as the visible spectrum.
The sensing eye and the perceiving visual cortex
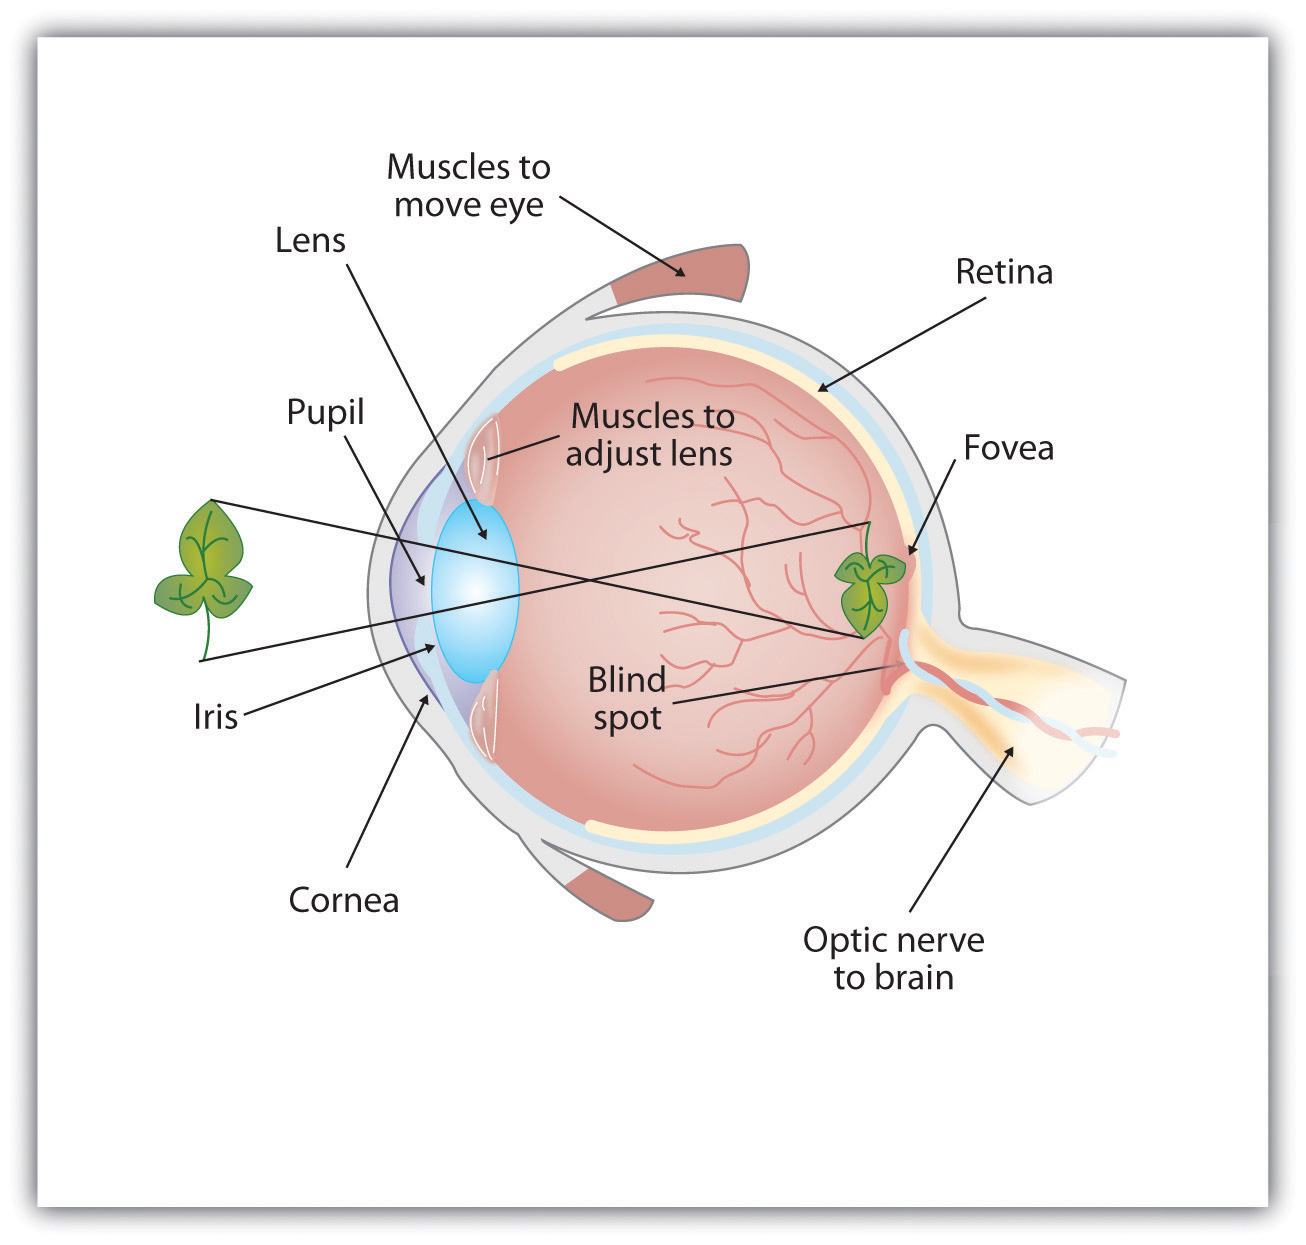
Light enters the eye through the cornea, which is a clear covering that protects the eye and begins to focus the incoming light (see Figure 5.5). The light then passes through the pupil, a small opening in the centre of the eye. The pupil is surrounded by the iris, the coloured part of the eye that controls the size of the pupil by constricting or dilating in response to light intensity. When we enter a dark movie theatre on a sunny day, for instance, muscles in the iris open the pupil and allow more light to enter. Complete adaptation to the dark may take up to 20 minutes.
Behind the pupil is the lens, a structure that focuses the incoming light on the retina, the layer of tissue at the back of the eye that contains photoreceptor cells. As our eyes move from near objects to distant objects, a process known as visual accommodation occurs. Visual accommodation is the process of changing the curvature of the lens to keep the light entering the eye focused on the retina. Rays from the top of the image strike the bottom of the retina, and vice versa, whereas rays from the left side of the image strike the right part of the retina, and vice versa. This causes the image on the retina to be upside down and backward. Furthermore, the image projected on the retina is flat, and yet our final perception of the image will be three-dimensional.
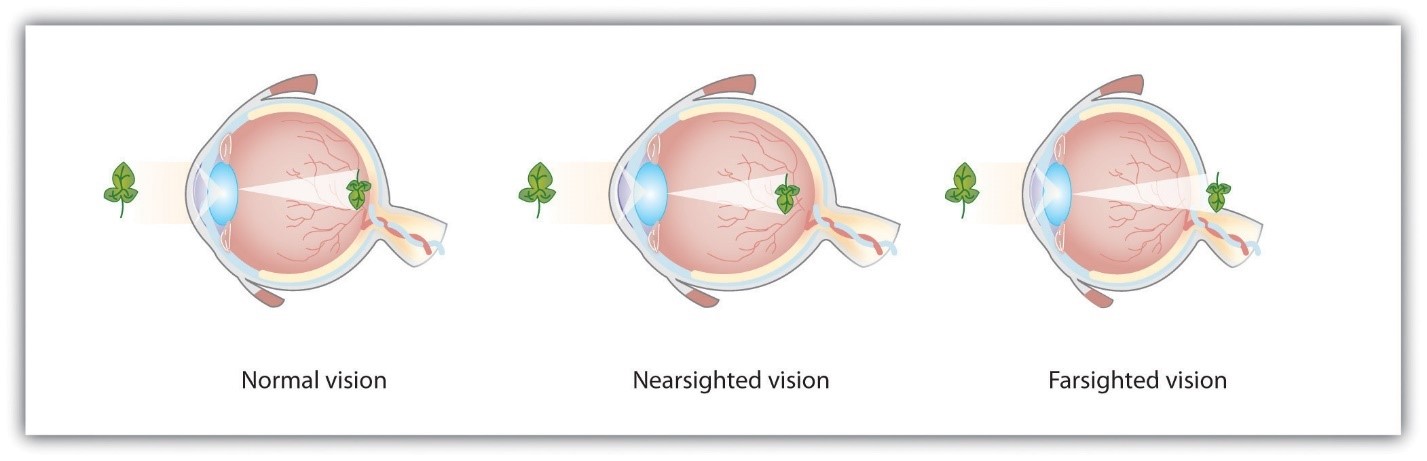
Accommodation is not always perfect. If the focus is in front of the retina, we say that the person is nearsighted, and when the focus is behind the retina, we say that the person is farsighted (see Figure 5.6). Eyeglasses and contact lenses correct this problem by adding another lens in front of the eye, and laser eye surgery corrects the problem by reshaping the eye’s own lens. Failure of the lens to accommodate, especially to close objects, is common in people over 40. This condition is termed presbyopia, and it is caused by decreased flexibility in the lens.
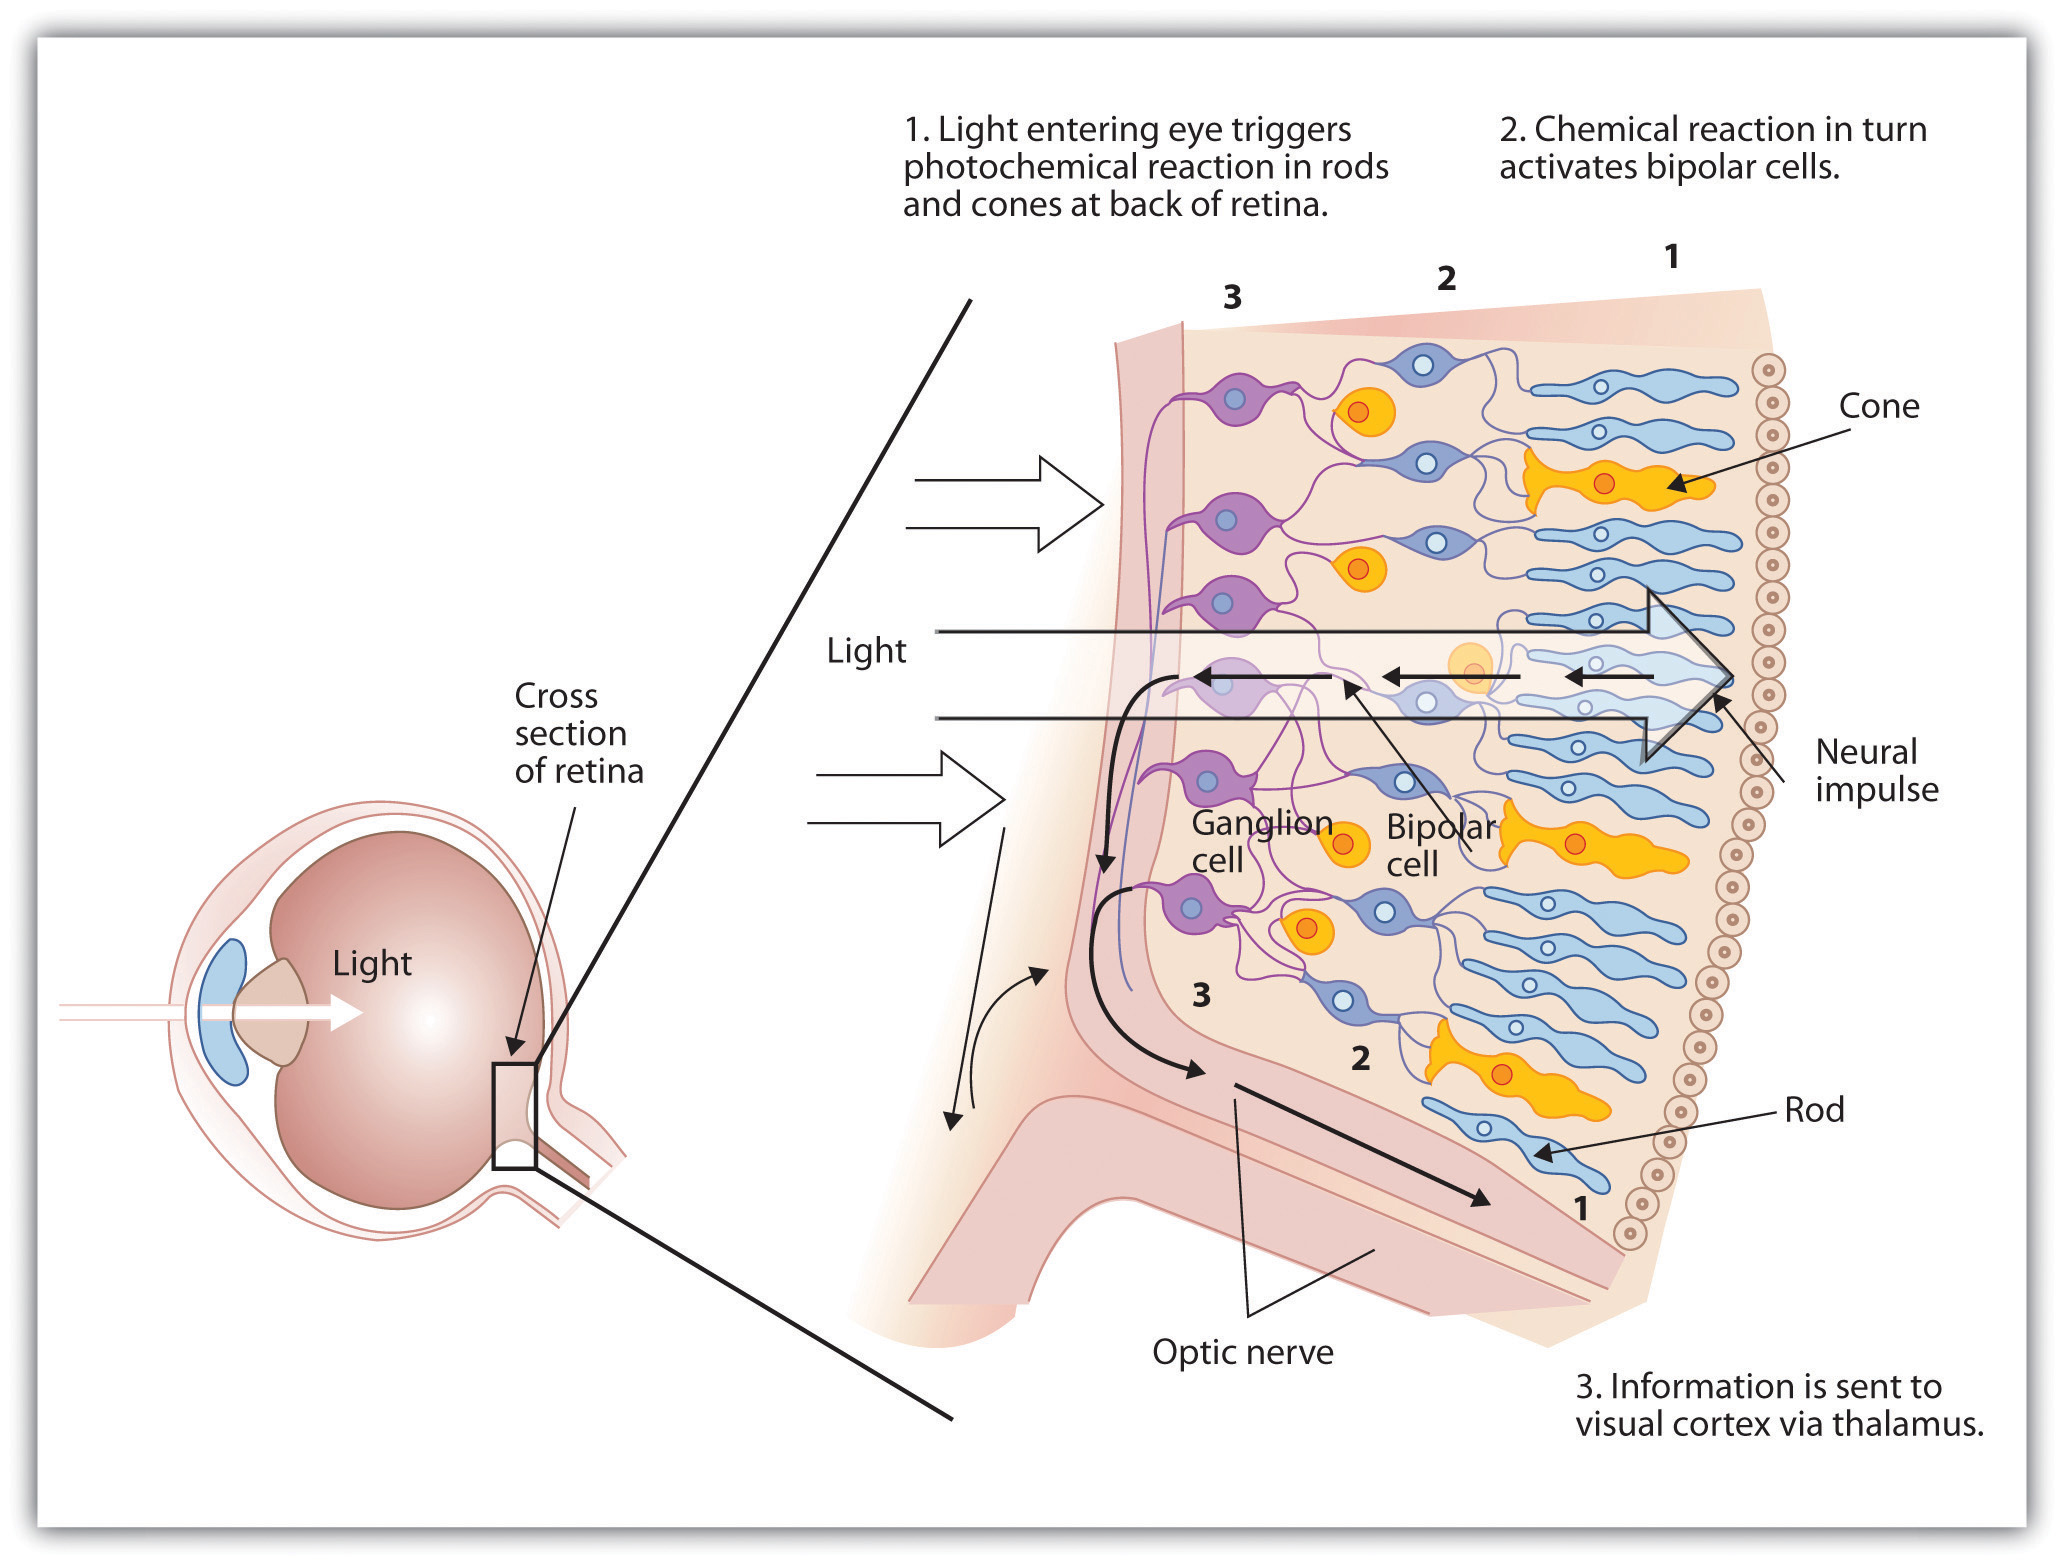
The retina contains layers of neurons specialized to respond to light (see Figure 5.7). As light falls on the retina, it first activates receptor cells known as rods and cones. Then, the activation of these cells spreads to the bipolar cells and on to the ganglion cells, which gather together and converge, like the strands of a rope, forming the optic nerve. The optic nerve is a collection of millions of ganglion neurons that sends vast amounts of visual information, via the thalamus, to the brain. Because the retina and the optic nerve are active processors and analyzers of visual information, it is appropriate to think of these structures as an extension of the brain itself.
Rods are visual neurons that specialize in detecting black, white, and grey colours. There are about 120 million rods in each eye. The rods do not provide a lot of detail about the images we see, but because they are highly sensitive to shorter-waved and weak light, they help us see in dim light — for instance, at night. Because the rods are located primarily around the edges of the retina, they are particularly active in peripheral vision; when you need to see something at night, try looking away from what you want to see. Cones are visual neurons that are specialized in detecting fine detail and colours. The five million or so cones in each eye enable us to see in colour, but they operate best in bright light. The cones are located primarily in and around the fovea, which is the central point of the retina.
To demonstrate the difference between rods and cones in attention to detail, choose a word in this text and focus on it. Do you notice that the words a few centimetres away on each side seem blurred? This is because the word you are focusing on strikes the detail-oriented cones, while the words surrounding it strike the less-detail-oriented rods, which are located on the periphery.
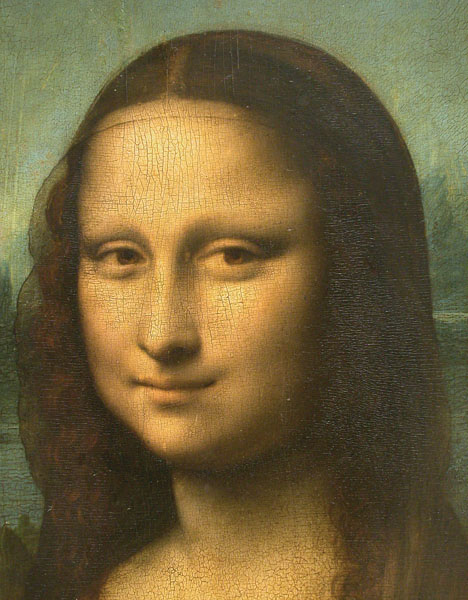
Margaret Livingstone (2000) found an interesting effect that demonstrates the different processing capacities of the eye’s rods and cones — namely, that the Mona Lisa’s smile, which is widely referred to as “elusive,” is perceived differently depending on how one looks at the painting (see Figure 5.8). Because Leonardo da Vinci painted the smile in low-detail brush strokes, these details are better perceived by our peripheral vision, that is to say, by the rods rather than by the cones. Livingstone found that people rated the Mona Lisa as more cheerful when they were instructed to focus on her eyes than they did when they were asked to look directly at her mouth. As Livingstone put it, “She smiles until you look at her mouth, and then it fades, like a dim star that disappears when you look directly at it” (p. 1299).
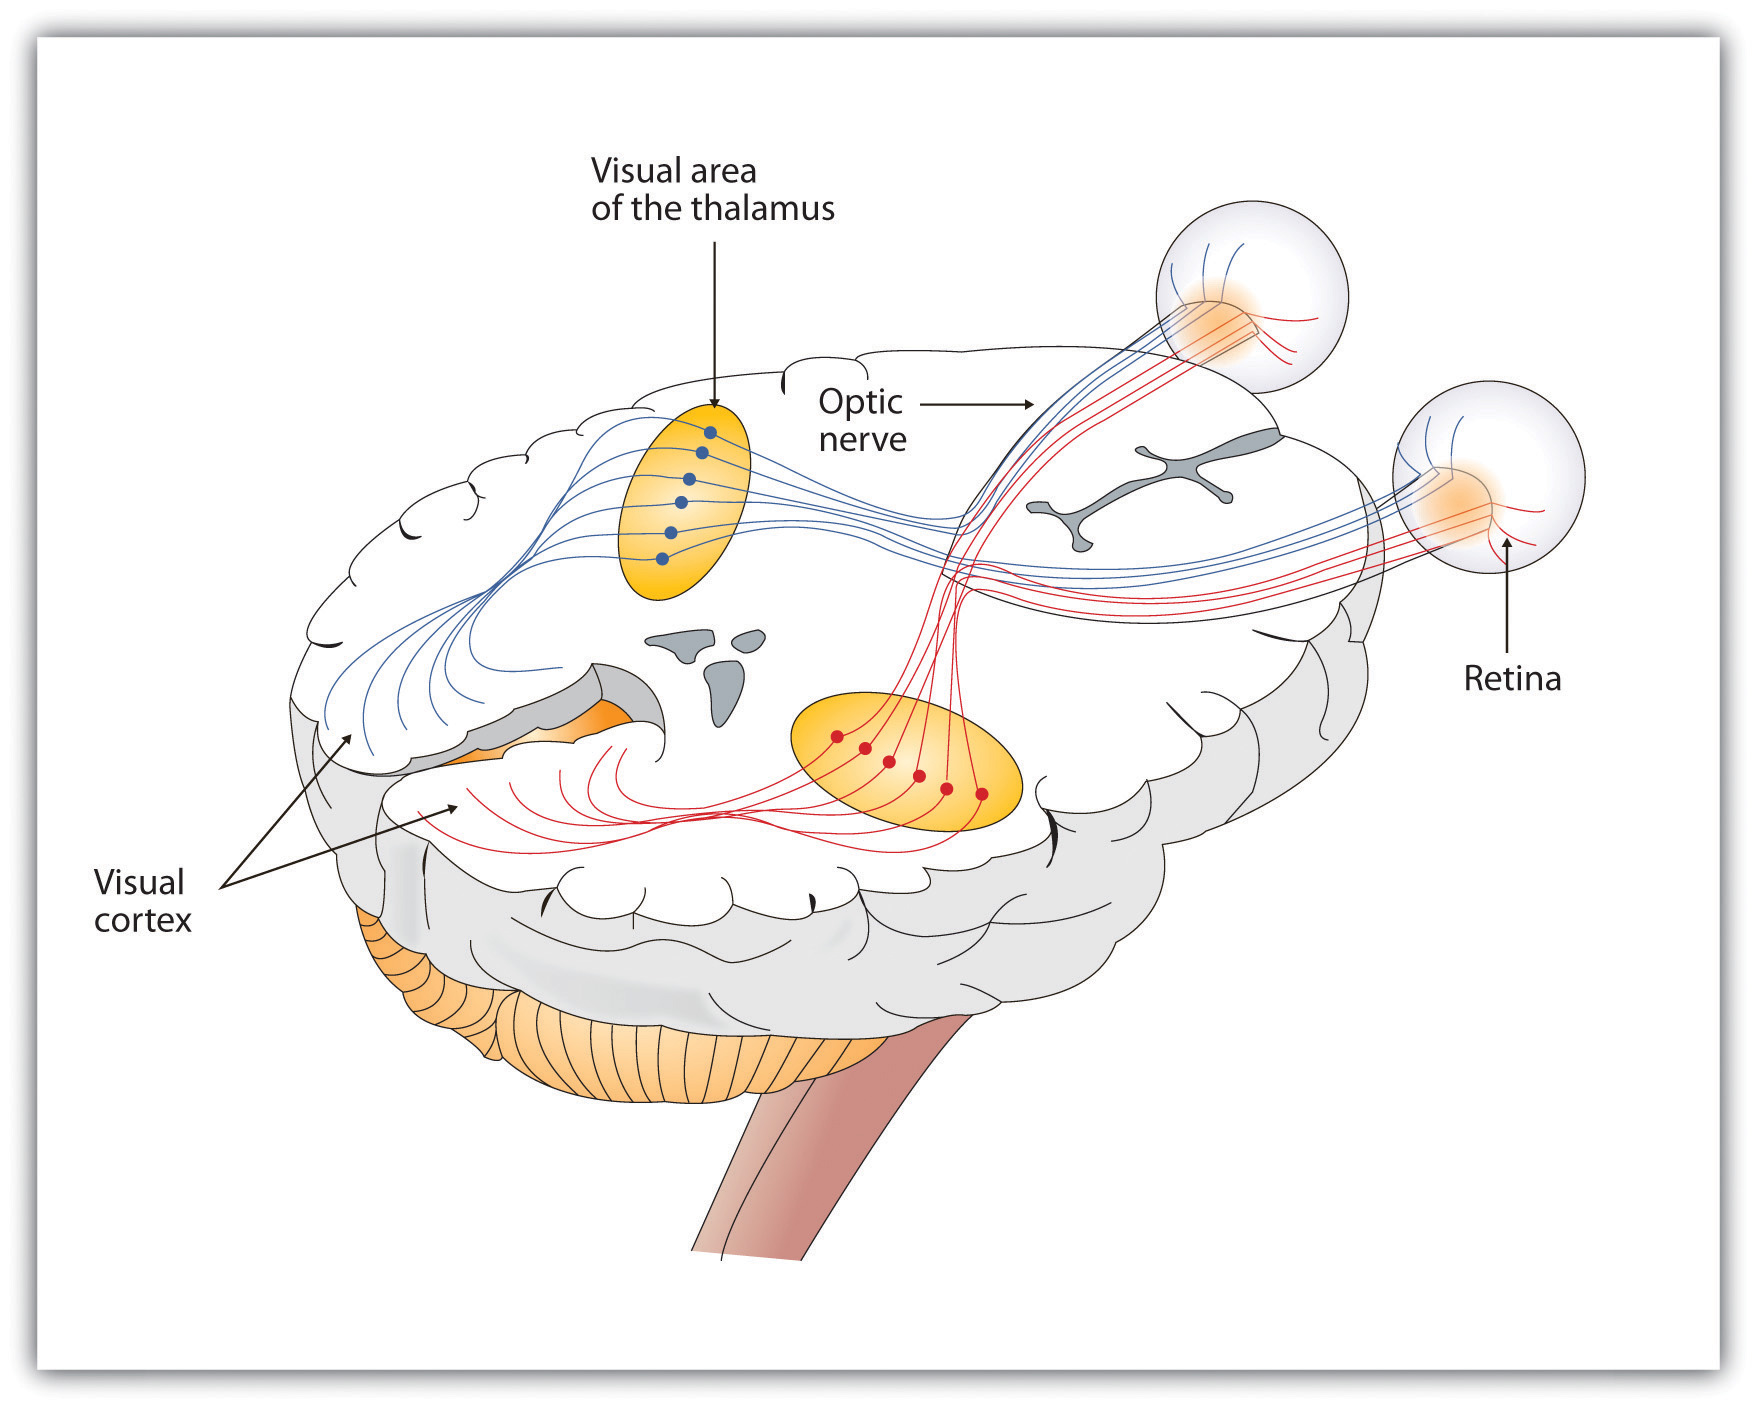
The sensory information received by the retina is relayed through the thalamus to corresponding areas in the visual cortex, which is located in the occipital lobe at the back of the brain (see Figure 5.9). Although the principle of contralateral control might lead you to expect that the left eye would send information to the right brain hemisphere, and vice versa, nature is smarter than that. In fact, the left and right eyes each send information to both the left and the right hemisphere, and the visual cortex processes each of the cues separately and in parallel. This is an adaptational advantage to an organism that loses sight in one eye, because even if only one eye is functional, both hemispheres will still receive input from it.
The visual cortex is made up of specialized neurons that turn the sensations they receive from the optic nerve into meaningful images. Because there are no photoreceptor cells at the place where the optic nerve leaves the retina, a blind spot in our vision is created (see Figure 5.10). When both of our eyes are open, we do not experience a problem because our eyes are constantly moving, and one eye makes up for what the other eye misses. However, the visual system is also designed to deal with this problem if only one eye is open; the visual cortex simply fills in the small hole in our vision with similar patterns from the surrounding areas, and we never notice the difference. The ability of the visual system to cope with the blind spot is another example of how sensation and perception work together to create meaningful experience.

Perception is created, in part, through the simultaneous action of thousands of feature detector neurons, which are specialized neurons located in the visual cortex, that respond to the strength, angles, shapes, edges, and movements of a visual stimulus (Kelsey, 1997; Livingstone & Hubel, 1988). The feature detectors work alongside each other, each performing a specialized function. When faced with a red square, for instance, the parallel line feature detectors, the horizontal line feature detectors, and the red colour feature detectors all become activated. This activation is then passed on to other parts of the visual cortex, where other neurons compare the information supplied by the feature detectors with images stored in memory. Suddenly, in a flash of recognition, the many neurons fire together, creating the single image of the red square that we experience (Rodriguez et al., 1999). The Necker cube (see Figure 5.11) provides an example of how the visual system creates perceptions out of sensations.

Some feature detectors are tuned to selectively respond to particularly important objects, such as faces, smiles, and other parts of the body (Downing, Jiang, Shuman, & Kanwisher, 2001; Haxby et al., 2001). When researchers disrupted face recognition areas of the cortex using the magnetic pulses of transcranial magnetic stimulation, people were temporarily unable to recognize faces, and yet they were still able to recognize houses (McKone, Kanwisher, & Duchaine, 2007; Pitcher, Walsh, Yovel, & Duchaine, 2007).
Perceiving colour
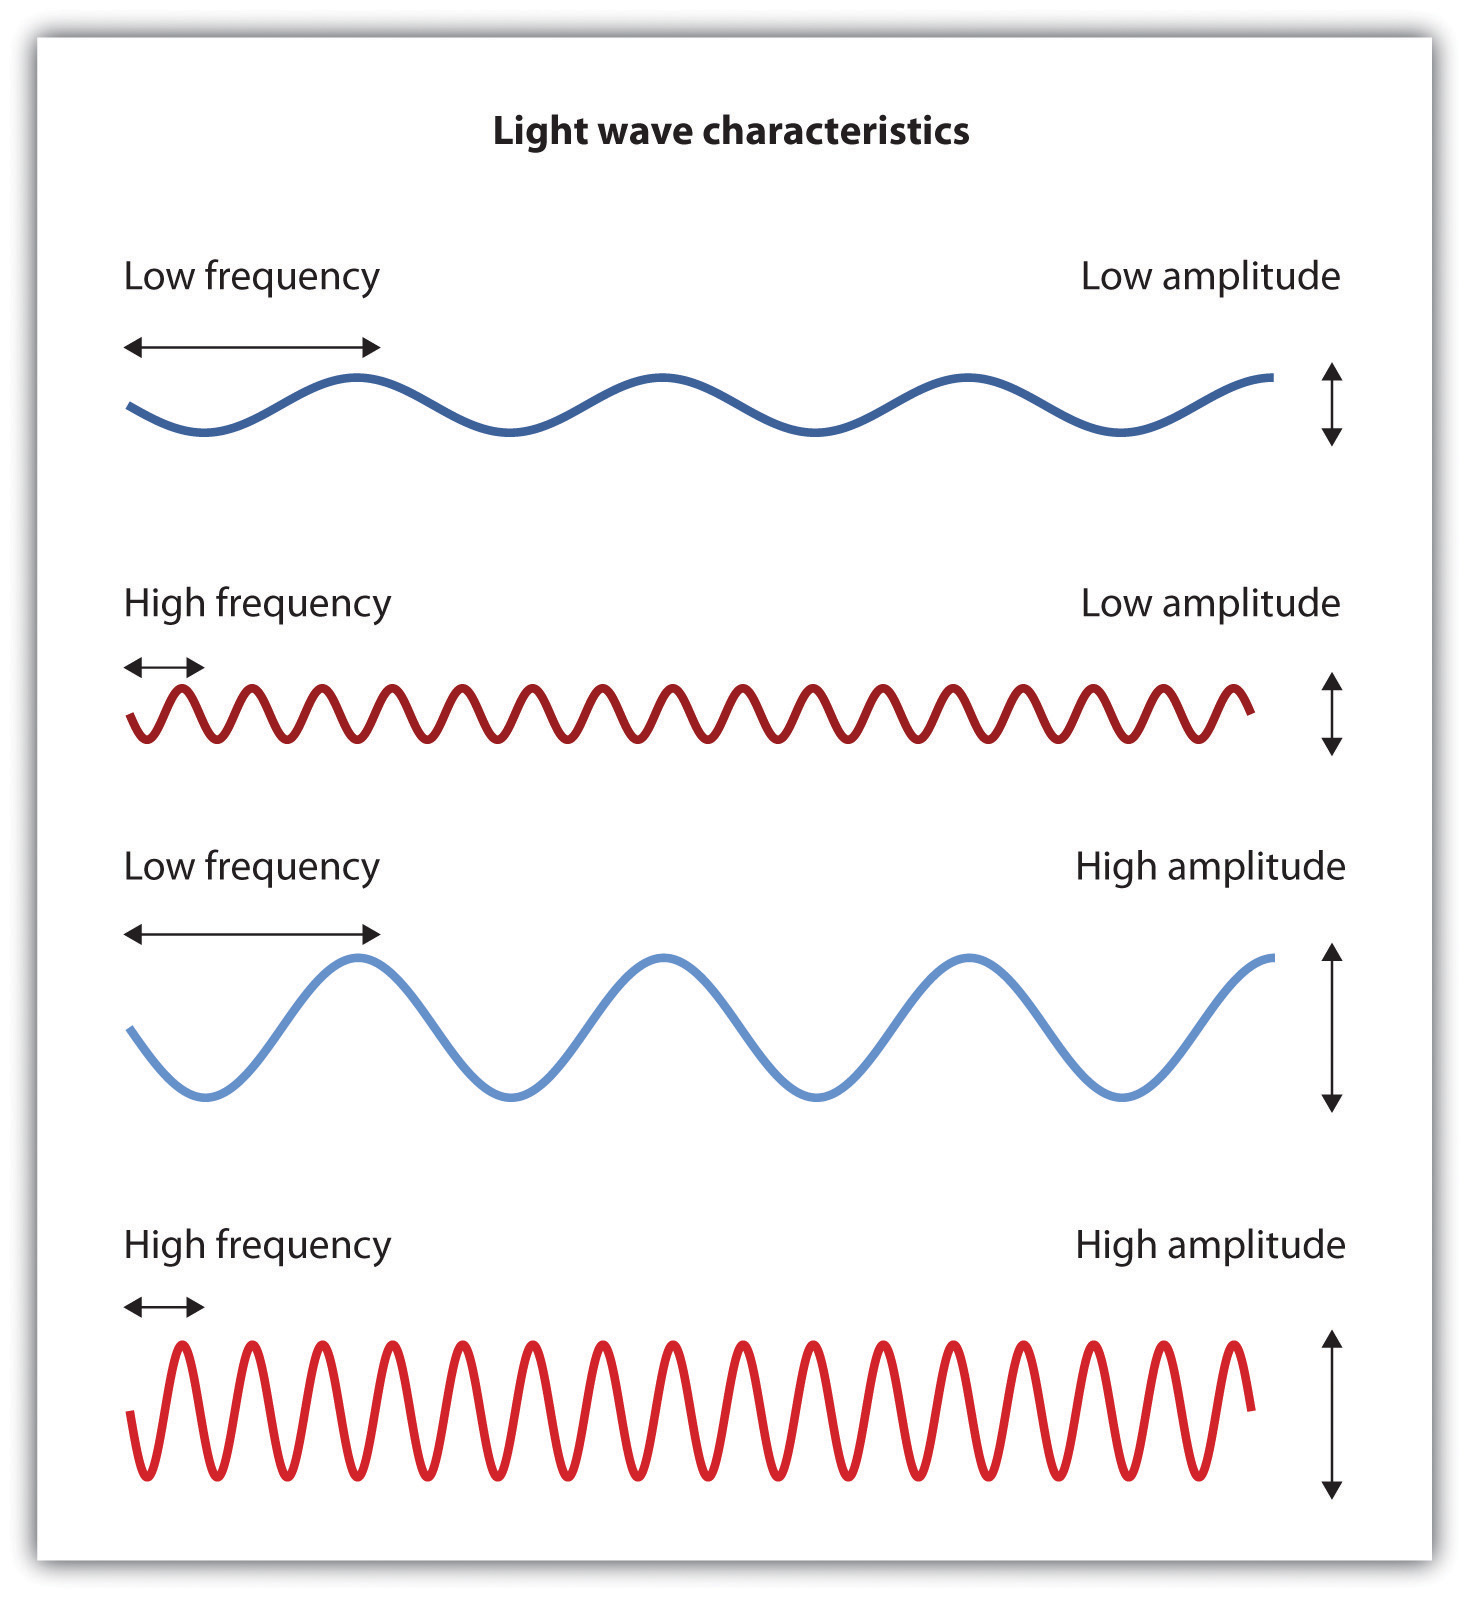
It has been estimated that the human visual system can detect and discriminate among seven million colour variations (Geldard, 1972), but these variations are all created by the combinations of the three primary colours: red, green, and blue. The shade of a colour, known as hue, is conveyed by the wavelength of the light that enters the eye; we see shorter wavelengths as more blue and longer wavelengths as more red. The brightness of a colour, known as intensity, is conveyed by the height of the light wave (see Figure 5.12); bigger or more intense waves are perceived as brighter.
In his important research on colour vision, Hermann von Helmholtz (1821–1894) theorized that colour is perceived because the cones in the retina come in three types. One type of cone reacts primarily to blue light (i.e., short wavelengths), another reacts primarily to green light (i.e., medium wavelengths), and a third reacts primarily to red light (i.e., long wavelengths). The visual cortex then detects and compares the strength of the signals from each of the three types of cones, creating the experience of colour. According to this Young-Helmholtz trichromatic colour theory, the colour we see depends on the mix of the signals from the three types of cones. If the brain is receiving primarily red and blue signals, for instance, it will perceive purple; if it is receiving primarily red and green signals, it will perceive yellow; and if it is receiving messages from all three types of cones, it will perceive white.
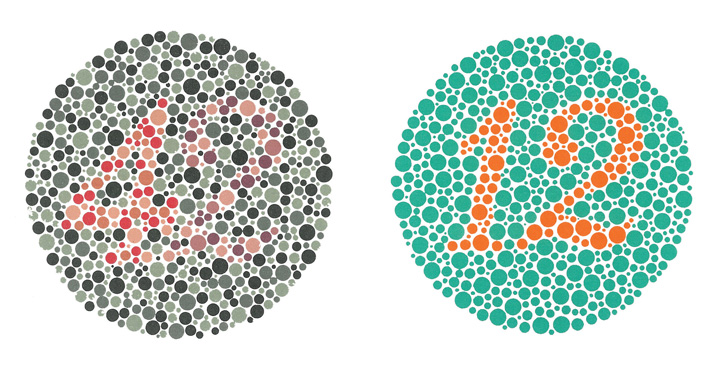
The different functions of the three types of cones are apparent in people who experience colour blindness — the inability to detect green and/or red colours (see Figure 5.13). About one in 50 people, mostly men, lack functioning in the red- or green-sensitive cones, leaving them only able to experience either one or two colours.
The trichromatic colour theory cannot explain all of human vision, however. For one, although the colour purple does appear to us as a mix of red and blue, yellow does not appear to be a mix of red and green. Additionally, people with colour blindness, who cannot see either green or red, nevertheless can still see yellow. An alternative approach to the Young-Helmholtz theory, known as the opponent-process colour theory, proposes that we analyze sensory information not in terms of three colours, but rather in three sets of opponent colours: red-green, yellow-blue, and white-black. Evidence for the opponent-process theory comes from the fact that some neurons in the retina and in the visual cortex are excited by one colour (e.g., red) but inhibited by another colour (e.g., green).
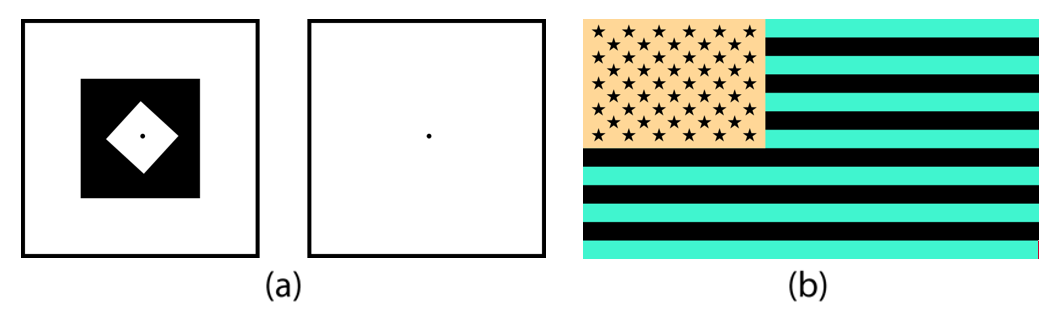
One example of opponent processing occurs in the experience of an afterimage. If you stare at the shape on the left side of Figure 5.14 (a) for about 30 seconds, and then move your eyes to the blank square next to it, you will see the afterimage; the longer you look, the better the effect. Now, try this by staring at the reverse image of the United States flag in Figure 5.14 (b), and then shift your eyes to a white surface. With the green in the image, our green receptors habituate and begin to process less strongly, whereas the red receptors remain at full strength. When we switch our gaze, we see primarily the red part of the opponent process. Similar processes create white after black and blue after yellow. The inverted image of the flag should revert back to the red, white, and blue we are familiar with.
The tricolour and the opponent-process mechanisms work together to produce colour vision. When light rays enter the eye, the red, blue, and green cones on the retina respond in different degrees and send different strength signals of red, blue, and green through the optic nerve. The colour signals are then processed both by the ganglion cells and by the neurons in the visual cortex (Gegenfurtner & Kiper, 2003).
Perceiving form
One of the important processes required in vision is the perception of form. German psychologists in the 1930s and 1940s, including Max Wertheimer (1880–1943), Kurt Koffka (1886–1941), and Wolfgang Köhler (1887–1967), argued that we create forms out of their component sensations based on the idea of the gestalt, a meaningfully organized whole. The idea of the gestalt is that the whole is more than the sum of its parts. Some examples of how gestalt principles lead us to see more than what is actually there are summarized in the table below.
| Principle | Description | Example | Image |
|---|---|---|---|
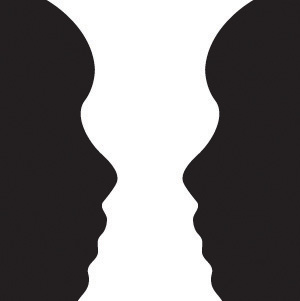
| Figure and ground | We structure input so that we always see a figure (i.e., image) against a ground (i.e., background). | You may see a vase, or you may see two faces. In either case, your brain organizes the image as a figure against a ground. |
|
| Similarity | Stimuli that are similar to each other tend to be grouped together. | You are more likely to see three similar columns among the XYX characters than you are to see four rows. |
|
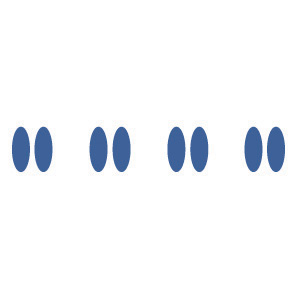
| Proximity | We tend to group nearby figures together. | Do you see four or eight images? Principles of proximity suggest that you might see only four. |
|
| Continuity | We tend to perceive stimuli in smooth, continuous ways rather than in more discontinuous ways. | Most people see a line of dots that moves from the lower left to the upper right, rather than a line that moves from the left and then suddenly turns down. The principle of continuity leads us to see most lines as following the smoothest possible path. |
|
| Closure | We tend to fill in gaps in an incomplete image to create a complete, whole object. | Closure leads us to see a single, spherical object rather than a set of unrelated cones. |
|
| Images in this table are used under a CC BY-NC-SA 4.0 license.
|
|||


Perceiving depth
Depth perception is the ability to perceive three-dimensional space and to accurately judge distance. Without depth perception, we would be unable to drive a car, thread a needle, or simply navigate our way around the supermarket (Howard & Rogers, 2001). Research has found that depth perception is party based on innate capacities and partly learned through experience (Witherington, 2005).
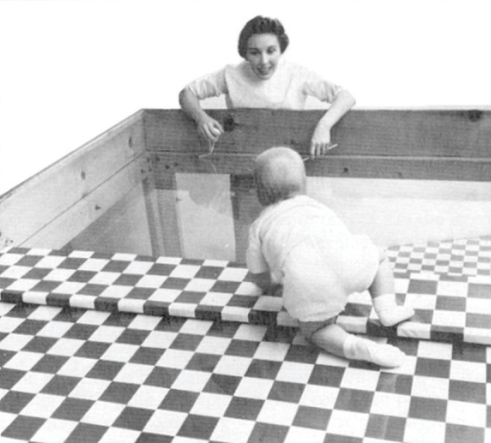
Psychologists Eleanor Gibson and Richard Walk (1960) tested the ability to perceive depth in 6- to 14-month-old infants by placing them on a visual cliff, a mechanism that gives the perception of a dangerous drop-off, in which infants can be safely tested for their perception of depth (see Figure 5.15). The infants were placed on one side of the “cliff,” while their mothers called to them from the other side. Gibson and Walk found that most infants either crawled away from the cliff or remained on the board and cried because they wanted to go to their mothers, but the infants perceived a chasm that they instinctively could not cross. Further research has found that even very young children who cannot yet crawl are fearful of heights (Campos, Langer, & Krowitz, 1970). On the other hand, studies have also found that infants improve their hand-eye coordination as they learn to better grasp objects and as they gain more experience in crawling, indicating that depth perception is also learned (Adolph, 2000).
Depth perception is the result of our use of depth cues, messages from our bodies and the external environment that supply us with information about space and distance. Binocular depth cues are depth cues that are created by retinal image disparity — that is, the space between our eyes — which require the coordination of both eyes. One outcome of retinal disparity is that the images projected on each eye are slightly different from each other. The visual cortex automatically merges the two images into one, enabling us to perceive depth. Three-dimensional movies make use of retinal disparity by using 3D glasses that the viewer wears to create a different image on each eye. The perceptual system quickly, easily, and unconsciously turns the disparity into three-dimensional images.
An important binocular depth cue is convergence, which is the inward turning of our eyes that is required to focus on objects that are less than about 15 metres away from us. The visual cortex uses the size of the convergence angle between the eyes to judge the object’s distance. You will be able to feel your eyes converging if you slowly bring a finger closer to your nose while continuing to focus on it. When you close one eye, you no longer feel the tension. Convergence is a binocular depth cue that requires both eyes to work.
The visual system also uses accommodation to help determine depth. As the lens changes its curvature to focus on distant or close objects, information relayed from the muscles attached to the lens helps us determine an object’s distance. However, accommodation is only effective at short viewing distances, so while it comes in handy when threading a needle or tying shoelaces, it is far less effective when driving or playing sports.
Although the best cues to depth occur when both eyes work together, we are able to see depth even with one eye closed. Monocular depth cues are depth cues that help us perceive depth using only one eye (Sekuler & Blake, 2006). Some of the most important monocular depth cues are summarized in the table below.
| Name | Description | Example | Image |
|---|---|---|---|
| Position | We tend to see objects higher up in our field of vision as farther away. | The fence posts in the upper right appear farther away, not only because they become smaller, but also because they appear higher up in the picture. |  |
| Relative size | Assuming that the objects in a scene are the same size, smaller objects are perceived as farther away. | The cars in the distance appear smaller than those nearer to us. |
|
| Linear perspective | Parallel lines appear to converge at a distance. | We know that the train tracks are parallel. When they appear closer together, we determine they are farther away. |
|
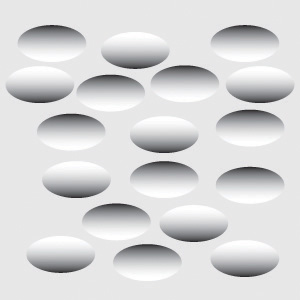
| Light and shadow | The eye receives more reflected light from objects that are closer to us. Normally, light comes from above, so darker images are in shadow. | We see the forms as either extended or indented, each according to their shadowing. If we invert the picture, each form would seem to be reversed. |
|
| Interposition | When one object overlaps another object, we view it as closer. | Since the blue star covers the purple bar, it is seen as closer than the yellow moon. |
|
| Aerial perspective | Objects that appear hazy, or that are covered with smog or dust, appear farther away. | The artist who painted this picture used aerial perspective to make the clouds more hazy and, thus, appear farther away. |
|
| Images in this table are used under a CC BY-NC-SA 4.0 license.
|
|||


Perceiving motion
Many animals, including human beings, have very sophisticated perceptual skills that allow them to coordinate their own motion with the motion of moving objects in order to create a collision with that object. Bats and birds use this mechanism to catch up with prey, dogs use it to catch a frisbee, and humans use it to catch a moving football. In terms of perceiving motion, objects that look bigger are usually closer to us; this is true partly because the brain detects motion from the changing size of an image on the retina and partly from the relative brightness of objects.
We also experience motion when objects near each other change their appearance. The beta effect refers to the perception of motion that occurs when different images are presented next to each other in succession (see Figure 5.16). The visual cortex fills in the missing part of the motion, and we see the object moving. The beta effect is used in movies to create the experience of motion. A related effect is the phi phenomenon, in which we perceive a sensation of motion caused by the appearance and disappearance of objects that are near each other (see Figure 5.17). The phi phenomenon looks like a moving zone or cloud of background colour surrounding the flashing objects. The beta effect and the phi phenomenon are other examples of the importance of the gestalt, which is our tendency to see more than the sum of the parts.

Key Takeaways
- Vision is the process of detecting the electromagnetic energy that surrounds us. Only a small fraction of the electromagnetic spectrum is visible to humans.
- The visual receptor cells on the retina detect shape, colour, motion, and depth.
- Light enters the eye through the transparent cornea and passes through the pupil at the centre of the iris. The lens adjusts to focus the light on the retina, where it appears upside down and backward. Receptor cells on the retina are excited or inhibited by the light and send information to the visual cortex through the optic nerve.
- The retina has two types of photoreceptor cells. Rods detect brightness and respond to black and white, whereas cones respond to red, green, and blue. Colour blindness occurs when people lack function in the red- or green-sensitive cones.
- Feature detector neurons in the visual cortex help us recognize objects, and some neurons respond selectively to faces and other body parts.
- The Young-Helmholtz trichromatic colour theory proposes that colour perception is the result of the signals sent by the three types of cones, whereas the opponent-process colour theory proposes that we perceive colour as three sets of opponent colours: red-green, yellow-blue, and white-black.
- The ability to perceive depth occurs as the result of binocular and monocular depth cues.
- Motion is perceived as a function of the size and brightness of objects. The beta effect and the phi phenomenon are examples of perceived motion.
Exercises and Critical Thinking
- Consider some ways that the processes of visual perception help you engage in everyday activities, like driving a car or riding a bicycle.
- Imagine for a moment what your life would be like if you could not see. Do you think you would be able to compensate for your loss of sight by using other senses?
Image Attributions
Figure 5.5. Used under a CC BY-NC-SA 4.0 license.
Figure 5.6. Used under a CC BY-NC-SA 4.0 license.
Figure 5.7. Used under a CC BY-NC-SA 4.0 license.
Figure 5.8. Mona Lisa Detail Face (Louvre Museum) by Ras67 has no known copyright restrictions.
Figure 5.9. Used under a CC BY-NC-SA 4.0 license.
Figure 5.10. Used under a CC BY-NC-SA 4.0 license.
Figure 5.11. Necker Cube by BenFrantzDale is used under a CC BY-SA 3.0 license.
Figure 5.12. Used under a CC BY-NC-SA 4.0 license.
Figure 5.13. Ishihara 23 by Nicoguaro is in the public domain; Ishihara 1 by Nicoguaro is in the public domain.
Figure 5.14. Nachbild by Freddy2001 is in the public domain; US flag (inverted) by MikeRS has no known copyright restrictions.
Figure 5.15. NIH Visual Cliff Experiment by Springer Nature is used under a CC BY 4.0 license.
Figure 5.16. Beta Movement by E vidal is in the public domain.
Figure 5.17. Lilac Chaser by TotoBaggins is used under a CC BY-SA 3.0 license.
References
Adolph, K. E. (2000). Specificity of learning: Why infants fall over a veritable cliff. Psychological Science, 11(4), 290–295.
Campos, J. J., Langer, A., & Krowitz, A. (1970). Cardiac responses on the visual cliff in prelocomotor human infants. Science, 170(3954), 196–197.
Downing, P. E., Jiang, Y., Shuman, M., & Kanwisher, N. (2001). A cortical area selective for visual processing of the human body. Science, 293(5539), 2470–2473.
Gegenfurtner, K. R., & Kiper, D. C. (2003). Color vision. Annual Review of Neuroscience, 26, 181–206.
Geldard, F. A. (1972). The human senses (2nd ed.). New York, NY: Wiley.
Gibson, E. J., & Walk, R. D. (1960). The “visual cliff.” Scientific American, 202(4), 64–71.
Haxby, J. V., Gobbini, M. I., Furey, M. L., Ishai, A., Schouten, J. L., & Pietrini, P. (2001). Distributed and overlapping representations of faces and objects in ventral temporal cortex. Science, 293(5539), 2425–2430.
Howard, I. P., & Rogers, B. J. (2001). Seeing in depth: Basic mechanisms (Vol. 1). Toronto, ON: Porteous.
Kelsey, C. A. (1997). Detection of visual information. In W. R. Hendee & P. N. T. Wells (Eds.), The perception of visual information (2nd ed., pp. 33–56). New York, NY: Springer-Verlag.
Livingstone M. S. (2000). Is it warm? Is it real? Or just low spatial frequency? Science, 290, 1299.
Livingstone, M. S., & Hubel, D. (1988). Segregation of form, color, movement, and depth: Anatomy, physiology, and perception. Science, 240, 740–749.
McKone, E., Kanwisher, N., & Duchaine, B. C. (2007). Can generic expertise explain special processing for faces? Trends in Cognitive Sciences, 11, 8–15.
Pitcher, D., Walsh, V., Yovel, G., & Duchaine, B. (2007). TMS evidence for the involvement of the right occipital face area in early face processing. Current Biology, 17, 1568–1573.
Rodriguez, E., George, N., Lachaux, J.-P., Martinerie, J., Renault, B., & Varela, F. J. (1999). Perception’s shadow: Long-distance synchronization of human brain activity. Nature, 397(6718), 430–433.
Sekuler, R., & Blake, R. (2006). Perception (5th ed.). New York, NY: McGraw-Hill.
Witherington, D. C. (2005). The development of prospective grasping control between 5 and 7 months: A longitudinal study. Infancy, 7(2), 143–161.

.svg)
.png)