2.2 Research Designs in Psychology
Learning Objectives
- Differentiate the goals of descriptive, correlational, and experimental research designs, and explain the advantages and disadvantages of each.
Psychologists agree that if their ideas and theories about human behaviour are to be taken seriously, they must be backed up by data. Researchers have a variety of research designs available to them in testing their predictions. A research design is the specific method a researcher uses to collect, analyze, and interpret data. Psychologists use three major types of research designs in their research, and each provides an essential avenue for scientific investigation. Descriptive research is designed to provide a snapshot of the current state of affairs. Correlational research is designed to discover relationships among variables. Experimental research is designed to assess cause and effect. Each of the three research designs has specific strengths and limitations, and it is important to understand how each differs. See the table below for a summary.
| Research Design | Goal | Advantages | Disadvantages |
|---|---|---|---|
| Descriptive | To create a snapshot of the current state of affairs. | Provides a relatively complete picture of what is occurring at a given time. Allows the development of questions for further study. | Does not assess relationships among variables. Cannot be used to draw inferences about cause and effect. |
| Correlational | To assess the relationships between and among two or more variables. | Allows testing of expected relationships between and among variables and the making of predictions. Can assess these relationships in everyday life events. | Cannot be used to draw inferences about cause and effect. |
| Experimental | To assess the causal impact of one or more experimental manipulations on a dependent variable. | Allows conclusions to be drawn about the causal relationships among variables. | Cannot experimentally manipulate many important variables. May be expensive and time-consuming. |
| Data source: Stangor, 2011. | |||
Descriptive research: Assessing the current state of affairs
Descriptive research is designed to create a snapshot of the current thoughts, feelings, or behaviour of individuals. This section reviews four types of descriptive research: case studies, surveys and tests, naturalistic observation, and laboratory observation.
Sometimes the data in a descriptive research project are collected from only a small set of individuals, often only one person or a single small group. These research designs are known as case studies, which are descriptive records of one or more individual’s experiences and behaviour. Sometimes case studies involve ordinary individuals, as when developmental psychologist Jean Piaget used his observation of his own children to develop his stage theory of cognitive development. More frequently, case studies are conducted on individuals who have unusual or abnormal experiences or characteristics, this may include those who find themselves in particularly difficult or stressful situations. The assumption is that carefully studying individuals can give us results that tell us something about human nature. Of course, one individual cannot necessarily represent a larger group of people who were in the same circumstances.
Sigmund Freud was a master of using the psychological difficulties of individuals to draw conclusions about basic psychological processes. Freud wrote case studies of some of his most interesting patients and used these careful examinations to develop his important theories of personality. One classic example is Freud’s description of “Little Hans,” a child whose fear of horses was interpreted in terms of repressed sexual impulses and the Oedipus complex (Freud, 1909/1964).

Another well-known case study is of Phineas Gage, a man whose thoughts and emotions were extensively studied by cognitive psychologists after a railroad spike was blasted through his skull in an accident. Although there are questions about the interpretation of this case study (Kotowicz, 2007), it did provide early evidence that the brain’s frontal lobe is involved in emotion and morality (Damasio et al., 2005). An interesting example of a case study in clinical psychology is described by Milton Rokeach (1964), who investigated in detail the beliefs of and interactions among three patients with schizophrenia, all of whom were convinced they were Jesus Christ.
Research using case studies has some unique challenges when it comes to interpreting the data. By definition, case studies are based on one or a very small number of individuals. While their situations may be unique, we cannot know how well they represent what would be found in other cases. Furthermore, the information obtained in a case study may be inaccurate or incomplete. While researchers do their best to objectively understand one case, making any generalizations to other people is problematic. Researchers can usually only speculate about cause and effect, and even then, they must do so with great caution. Case studies are particularly useful when researchers are starting out to study something about which there is not much research or as a source for generating hypotheses that can be tested using other research designs.
In other cases, the data from descriptive research projects come in the form of a survey, which is a measure administered through either an interview or a written questionnaire to get a picture of the beliefs or behaviours of a sample of people of interest. The people chosen to participate in the research, known as the sample, are selected to be representative of all the people that the researcher wishes to know about, known as the population. The representativeness of samples is enormously important. For example, a representative sample of Canadians must reflect Canada’s demographic make-up in terms of age, sex, gender orientation, socioeconomic status, ethnicity, and so on. Research based on unrepresentative samples is limited in generalizability, meaning it will not apply well to anyone who was not represented in the sample. Psychologists use surveys to measure a wide variety of behaviours, attitudes, opinions, and facts. Surveys could be used to measure the amount of exercise people get every week, eating or drinking habits, attitudes towards climate change, and so on. These days, many surveys are available online, and they tend to be aimed at a wide audience. Statistics Canada is a rich source of surveys of Canadians on a diverse array of topics. Their databases are searchable and downloadable, and many deal with topics of interest to psychologists, such as mental health, wellness, and so on. Their raw data may be used by psychologists who are able to take advantage of the fact that the data have already been collected. This is called archival research.
Related to surveys are psychological tests. These are measures developed by psychologists to assess one’s score on a psychological construct, such as extroversion, self-esteem, or aptitude for a particular career. The difference between surveys and tests is really down to what is being measured, with surveys more likely to be fact-gathering and tests more likely to provide a score on a psychological construct.
As you might imagine, respondents to surveys and psychological tests are not always accurate or truthful in their replies. Respondents may also skew their answers in the direction they think is more socially desirable or in line with what the researcher expects. Sometimes people do not have good insight into their own behaviour and are not accurate in judging themselves. Sometimes tests have built-in social desirability or lie scales that attempt to help researchers understand when someone’s scores might need to be discarded from the research because they are not accurate.
Tests and surveys are only useful if they are valid and reliable. Validity exists when an instrument actually measures what you think it measures (e.g., a test of intelligence that actually measures how many years of education you have lacks validity). Demonstrating the validity of a test or survey is the responsibility of any researcher who uses the instrument. Reliability is a related but different construct; it exists when a test or survey gives the same responses from time to time or in different situations. For example, if you took an intelligence test three times and every time it gave you a different score, that would not be a reliable test. Demonstrating the reliability of tests and surveys is another responsibility of researchers. There are different types of validity and reliability, and there is a branch of psychology devoted to understanding not only how to demonstrate that tests and surveys are valid and reliable, but also how to improve them.
An important criticism of psychological research is its reliance on so-called WEIRD samples (Henrich, Heine, & Norenzayan, 2010). WEIRD stands for Western, educated, industrialized, rich, and democratic. People fitting the WEIRD description have been over-represented in psychological research, while people from poorer, less-educated backgrounds, for example, have participated far less often. This criticism is important because in psychology we may be trying to understand something about people in general. For example, if we want to understand whether early enrichment programs can boost IQ scores later, we need to conduct this research using people from a variety of backgrounds and situations. Most of the world’s population is not WEIRD, so psychologists trying to conduct research that has broad generalizability need to expand their participant pool to include a more representative sample.
Another type of descriptive research is naturalistic observation, which refers to research based on the observation of everyday events. For instance, a developmental psychologist who watches children on a playground and describes what they say to each other while they play is conducting naturalistic observation, as is a biopsychologist who observes animals in their natural habitats. Naturalistic observation is challenging because, in order for it to be accurate, the observer must be effectively invisible. Imagine walking onto a playground, armed with a clipboard and pencil to watch children a few feet away. The presence of an adult may change the way the children behave; if the children know they are being watched, they may not behave in the same ways as they would when no adult is present. Researchers conducting naturalistic observation studies have to find ways to recede into the background so that their presence does not cause the behaviour they are watching to change. They also must find ways to record their observations systematically and completely — not an easy task if you are watching children, for example. As such, it is common to have multiple observers working independently; their combined observations can provide a more accurate record of what occurred.
Sometimes, researchers conducting observational research move out of the natural world and into a laboratory. Laboratory observation allows much more control over the situation and setting in which the participants will be observed. The downside to moving into a laboratory is the potential artificiality of the setting; the participants may not behave the same way in the lab as they would in the natural world, so the behaviour that is observed may not be completely authentic. Consider the researcher who is interested in aggression in children. They might go to a school playground and record what occurs; however, this could be quite time-consuming if the frequency is low or if the children are playing some distance away and their behaviour is difficult to interpret. Instead, the researcher could construct a play setting in a laboratory and attempt to observe aggressive behaviours in this smaller and more controlled context; for instance, they could only provide one highly desirable toy instead of one for each child. What they gain in control, they lose in artificiality. In this example, the possibility for children to act differently in the lab than they would in the real world would create a challenge in interpreting results.
Correlational research: Seeking relationships among variables
In contrast to descriptive research — which is designed primarily to provide a snapshot of behaviour, attitudes, and so on — correlational research involves measuring the relationship between two variables. Variables can be behaviours, attitudes, and so on. Anything that can be measured is a potential variable. The key aspect of correlational research is that the researchers are not asking some of their participants to do one thing and others to do something else; all of the participants are providing scores on the same two variables. Correlational research is not about how an individual scores; rather, it seeks to understand the association between two things in a larger sample of people. The previous comments about the representativeness of the sample all apply in correlational research. Researchers try to find a sample that represents the population of interest.
An example of correlation research would be to measure the association between height and weight. We should expect that there is a relationship because taller people have more mass and therefore should weigh more than short people. We know from observation, however, that there are many tall, thin people just as there are many short, overweight people. In other words, we would expect that in a group of people, height and weight should be systematically related (i.e., correlated), but the degree of relatedness is not expected to be perfect. Imagine we repeated this study with samples representing different populations: elite athletes, women over 50, children under 5, and so on. We might make different predictions about the relationship between height and weight based on the characteristics of the sample. This highlights the importance of obtaining a representative sample.
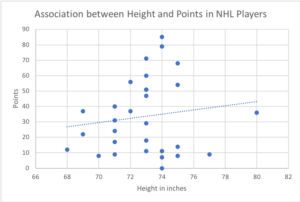
Psychologists make frequent use of correlational research designs. Examples might be the association between shyness and number of Facebook friends, between age and conservatism, between time spent on social media and grades in school, and so on. Correlational research designs tend to be relatively less expensive because they are time-limited and can often be conducted without much equipment. Online survey platforms have made data collection easier than ever. Some correlational research does not even necessitate collecting data; researchers using archival data sets as described above simply download the raw data from another source. For example, suppose you were interested in whether or not height is related to the number of points scored in hockey players. You could extract data for both variables from nhl.com, the official National Hockey League website, and conduct archival research using the data that have already been collected.
Correlational research designs look for associations between variables. A statistic that measures that association is the correlation coefficient. Correlation coefficients can be either positive or negative, and they range in value from -1.0 through 0 to 1.0. The most common statistical measure is the Pearson correlation coefficient, which is symbolized by the letter r. Positive values of r (e.g., r = .54 or r = .67) indicate that the relationship is positive, whereas negative values of r (e.g., r = –.30 or r = –.72) indicate negative relationships. The closer the coefficient is to -1 or +1, and the further away from zero, the greater the size of the association between the two variables. For instance, r = –.54 is a stronger relationship than r = .30, and r = .72 is a stronger relationship than r = –.57. Correlations of 0 indicate no relationship between the two variables.
Examples of positive correlation coefficients would include those between height and weight, between education and income, and between age and mathematical abilities in children. In each case, people who score higher, or lower, on one of the variables also tend to score higher, or lower, on the other variable. Negative correlations occur when people score high on one variable and low on the other. Examples of negative linear relationships include those between the age of a child and the number of diapers the child uses and between time practising and errors made on a learning task. In these cases, people who score higher on one of the variables tend to score lower on the other variable. Note that the correlation coefficient does not tell you anything about one specific person’s score.
One way of organizing the data from a correlational study with two variables is to graph the values of each of the measured variables using a scatterplot. A scatterplot is a visual image of the relationship between two variables (see Figure 2.3). A point is plotted for each individual at the intersection of his or her scores for the two variables. In this example, data extracted from the official National Hockey League (NHL) website of 30 randomly picked hockey players for the 2017/18 season. For each of these players, there is a dot representing player height and number of points (i.e., goals plus assists). The slope or angle of the dotted line through the middle of the scatter tells us something about the strength and direction of the correlation. In this case, the line slopes up slightly to the right, indicating a positive but small correlation. In these NHL players, there is not much of relationship between height and points. The Pearson correlation calculated for this sample is r = 0.14. It is possible that the correlation would be totally different in a different sample of players, such as a greater number, only those who played a full season, only rookies, only forwards, and so on.
For practise constructing and interpreting scatterplots, see the following:
- Interactive Quiz: Positive and Negative Associations in Scatterplots (Khan Academy, 2018)
When the association between the variables on the scatterplot can be easily approximated with a straight line, the variables are said to have a linear relationship. We are only going to consider linear relationships here. Just be aware that some pairs of variables have non-linear relationships, such as the relationship between physiological arousal and performance. Both high and low arousal are associated with sub-optimal performance, shown by a U-shaped scatterplot curve.
The most important limitation of correlational research designs is that they cannot be used to draw conclusions about the causal relationships among the measured variables; in other words, we cannot know what causes what in correlational research. Consider, for instance, a researcher who has hypothesized that viewing violent behaviour will cause increased aggressive play in children. The researcher has collected, from a sample of Grade 4 children, a measure of how many violent television shows each child views during the week as well as a measure of how aggressively each child plays on the school playground. From the data collected, the researcher discovers a positive correlation between the two measured variables.
Although this positive correlation appears to support the researcher’s hypothesis, it cannot be taken to indicate that viewing violent television causes aggressive behaviour. Although the researcher is tempted to assume that viewing violent television causes aggressive play, there are other possibilities. One alternative possibility is that the causal direction is exactly opposite of what has been hypothesized; perhaps children who have behaved aggressively at school are more likely to prefer violent television shows at home.
Still another possible explanation for the observed correlation is that it has been produced by a so-called third variable, one that is not part of the research hypothesis but that causes both of the observed variables and, thus, the correlation between them. In our example, a potential third variable is the discipline style of the children’s parents. Parents who use a harsh and punitive discipline style may allow children to watch violent television and to behave aggressively in comparison to children whose parents use less different types of discipline.
To review, whenever we have a correlation that is not zero, there are three potential pathways of cause and effect that must be acknowledged. The easiest way to practise understanding this challenge is to automatically designate the two variables X and Y. It does not matter which is which. Then, think through any ways in which X might cause Y. Then, flip the direction of cause and effect, and consider how Y might cause X. Finally, and possibly the most challenging, try to think of other variables — let’s call these C — that were not part of the original correlation, which cause both X and Y. Understanding these potential explanations for correlational research is an important aspect of scientific literacy. In the above example, we have shown how X (i.e., viewing violent TV) could cause Y (i.e., aggressive behaviour), how Y could cause X, and how C (i.e., parenting) could cause both X and Y.
Test your understanding with each example below. Find three different interpretations of cause and effect using the procedure outlined above. In each case, identify variables X, Y, and C:
- A positive correlation between dark chocolate consumption and health
- A negative correlation between sleep and smartphone use
- A positive correlation between children’s aggressiveness and time spent playing video games
- A negative association between time spent exercising and consumption of junk food
In sum, correlational research designs have both strengths and limitations. One strength is that they can be used when experimental research is not possible or when fewer resources are available. Correlational designs also have the advantage of allowing the researcher to study behaviour as it occurs in everyday life. We can also use correlational designs to make predictions, such as predicting the success of job trainees based on their test scores during training. They are also excellent sources of suggested avenues for further research, but we cannot use such correlational information to understand cause and effect. For that, researchers rely on experiments.
Experimental research: Understanding the causes of behaviour
The goal of experimental research design is to provide definitive conclusions about the causal relationships among the variables in the research hypothesis. In an experimental research design, there are independent variables and dependent variables. The independent variable is the one manipulated by the researchers so that there is more than one condition. The dependent variable is the outcome or score on the measure of interest that is dependent on the actions of the independent variable. Let’s consider a classic drug study to illustrate the relationship between independent and dependent variables. To begin, a sample of people with a medical condition are randomly assigned to one of two conditions. In one condition, they are given a drug over a period of time. In the other condition, a placebo is given for the same period of time. To be clear, a placebo is a type of medication that looks like the real thing but is actually chemically inert, sometimes referred to as a”sugar pill.” After the testing period, the groups are compared to see if the drug condition shows better improvement in health than the placebo condition.
While the basic design of experiments is quite simple, the success of experimental research rests on meeting a number of criteria. Some important criteria are:
- Participants must be randomly assigned to the conditions so that there are no differences between the groups. In the drug study example, you could not assign the males to the drug condition and the females to the placebo condition. The groups must be demographically equivalent.
- There must be a control condition. Having a condition that does not receive treatment allows experimenters to compare the results of the drug to the results of placebo.
- The only thing that can change between the conditions is the independent variable. For example, the participants in the drug study should receive the medication at the same place, from the same person, at the same time, and so on, for both conditions. Experiments often employ double-blind procedures in which neither the experimenter nor the participants know which condition any participant is in during the experiment. In a single-blind procedure, the participants do not know which condition they are in.
- The sample size has to be large and diverse enough to represent the population of interest. For example, a pharmaceutical company should not use only men in their drug study if the drug will eventually be prescribed to women as well.
- Experimenter effects should be minimized. This means that if there is a difference in scores on the dependent variable, they should not be attributable to something the experimenter did or did not do. For example, if an experiment involved comparing a yoga condition with an exercise condition, experimenters would need to make sure that they treated the participants exactly the same in each condition. They would need to control the amount of time they spent with the participants, how much they interacted verbally, smiled at the participants, and so on. Experimenters often employ research assistants who are blind to the participants’ condition to interact with the participants.
As you can probably see, much of experimental design is about control. The experimenters have a high degree of control over who does what. All of this tight control is to try to ensure that if there is a difference between the different levels of the independent variable, it is detectable. In other words, if there is even a small difference between a drug and placebo, it is detected. Furthermore, this level of control is aimed at ensuring that the only difference between conditions is the one the experimenters are testing while making correct and accurate determinations about cause and effect.
Research Focus
Video games and aggression
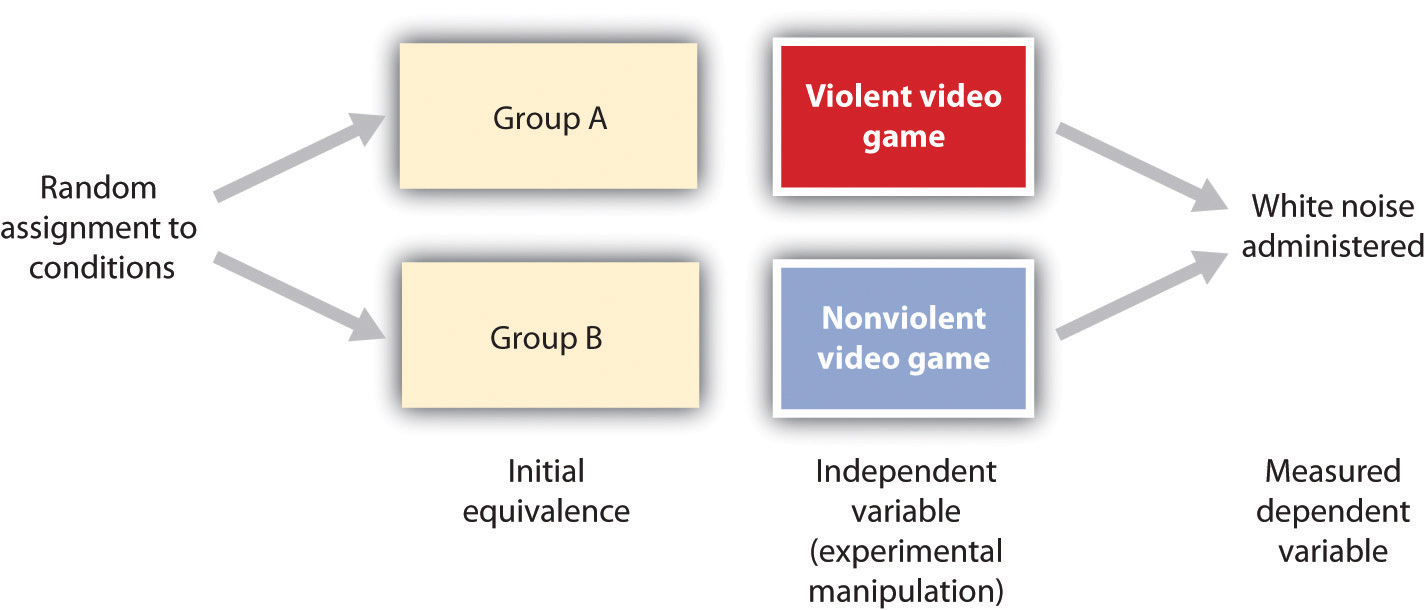
Consider an experiment conducted by Craig Anderson and Karen Dill (2000). The study was designed to test the hypothesis that viewing violent video games would increase aggressive behaviour. In this research, male and female undergraduates from Iowa State University were given a chance to play with either a violent video game (e.g., Wolfenstein 3D) or a nonviolent video game (e.g., Myst). During the experimental session, the participants played their assigned video games for 15 minutes. Then, after the play, each participant played a competitive game with an opponent in which the participant could deliver blasts of white noise through the earphones of the opponent. The operational definition of the dependent variable (i.e., aggressive behaviour) was the level and duration of noise delivered to the opponent. The design of the experiment is shown below (see Figure 2.4).
There are two strong advantages of the experimental research design. First, there is assurance that the independent variable, also known as the experimental manipulation, occurs prior to the measured dependent variable; second, there is creation of initial equivalence between the conditions of the experiment, which is made possible by using random assignment to conditions.
Experimental designs have two very nice features. For one, they guarantee that the independent variable occurs prior to the measurement of the dependent variable. This eliminates the possibility of reverse causation. Second, the influence of common-causal variables is controlled, and thus eliminated, by creating initial equivalence among the participants in each of the experimental conditions before the manipulation occurs.
The most common method of creating equivalence among the experimental conditions is through random assignment to conditions, a procedure in which the condition that each participant is assigned to is determined through a random process, such as drawing numbers out of an envelope or using a random number table. Anderson and Dill first randomly assigned about 100 participants to each of their two groups: Group A and Group B. Since they used random assignment to conditions, they could be confident that, before the experimental manipulation occurred, the students in Group A were, on average, equivalent to the students in Group B on every possible variable, including variables that are likely to be related to aggression, such as parental discipline style, peer relationships, hormone levels, diet — and in fact everything else.
Then, after they had created initial equivalence, Anderson and Dill created the experimental manipulation; they had the participants in Group A play the violent game and the participants in Group B play the nonviolent game. Then, they compared the dependent variable (i.e., the white noise blasts) between the two groups, finding that the students who had viewed the violent video game gave significantly longer noise blasts than did the students who had played the nonviolent game.
Anderson and Dill had from the outset created initial equivalence between the groups. This initial equivalence allowed them to observe differences in the white noise levels between the two groups after the experimental manipulation, leading to the conclusion that it was the independent variable, and not some other variable, that caused these differences. The idea is that the only thing that was different between the students in the two groups was the video game they had played.
Sometimes, experimental research has a confound. A confound is a variable that has slipped unwanted into the research and potentially caused the results because it has created a systematic difference between the levels of the independent variable. In other words, the confound caused the results, not the independent variable. For example, suppose you were a researcher who wanted to know if eating sugar just before an exam was beneficial. You obtain a large sample of students, divide them randomly into two groups, give everyone the same material to study, and then give half of the sample a chocolate bar containing high levels of sugar and the other half a glass of water before they write their test. Lo and behold, you find the chocolate bar group does better. However, the chocolate bar also contains caffeine, fat and other ingredients. These other substances besides sugar are potential confounds; for example, perhaps caffeine rather than sugar caused the group to perform better. Confounds introduce a systematic difference between levels of the independent variable such that it is impossible to distinguish between effects due to the independent variable and effects due to the confound.
Despite the advantage of determining causation, experiments do have limitations. One is that they are often conducted in laboratory situations rather than in the everyday lives of people. Therefore, we do not know whether results that we find in a laboratory setting will necessarily hold up in everyday life. Do people act the same in a laboratory as they do in real life? Often researchers are forced to balance the need for experimental control with the use of laboratory conditions that can only approximate real life.
Additionally, it is very important to understand that many of the variables that psychologists are interested in are not things that can be manipulated experimentally. For example, psychologists interested in sex differences cannot randomly assign participants to be men or women. If a researcher wants to know if early attachments to parents are important for the development of empathy, or in the formation of adult romantic relationships, the participants cannot be randomly assigned to childhood attachments. Thus, a large number of human characteristics cannot be manipulated or assigned. This means that research may look experimental because it has different conditions (e.g., men or women, rich or poor, highly intelligent or not so intelligent, etc.); however, it is quasi-experimental. The challenge in interpreting quasi-experimental research is that the inability to randomly assign the participants to condition results in uncertainty about cause and effect. For example, if you find that men and women differ in some ability, it could be biology that is the cause, but it is equally likely it could be the societal experience of being male or female that is responsible.
Of particular note, while experiments are the gold standard for understanding cause and effect, a large proportion of psychology research is not experimental for a variety of practical and ethical reasons.
Key Takeaways
- Descriptive, correlational, and experimental research designs are used to collect and analyze data.
- Descriptive designs include case studies, surveys, psychological tests, naturalistic observation, and laboratory observation. The goal of these designs is to get a picture of the participants’ current thoughts, feelings, or behaviours.
- Correlational research designs measure the relationship between two or more variables. The variables may be presented on a scatterplot to visually show the relationships. The Pearson correlation coefficient is a measure of the strength of linear relationship between two variables. Correlations have three potential pathways for interpreting cause and effect.
- Experimental research involves the manipulation of an independent variable and the measurement of a dependent variable. Done correctly, experiments allow researchers to make conclusions about cause and effect. There are a number of criteria that must be met in experimental design. Not everything can be studied experimentally, and laboratory experiments may not replicate real-life conditions well.
Exercises and Critical Thinking
- There is a negative correlation between how close students sit to the front of the classroom and their final grade in the class. Explain some possible reasons for this.
- Imagine you are tasked with creating a survey of online habits of Canadian teenagers. What questions would you ask and why? How valid and reliable would your test be?
- Imagine a researcher wants to test the hypothesis that participating in psychotherapy will cause a decrease in reported anxiety. Describe the type of research design the investigator might use to draw this conclusion. What would be the independent and dependent variables in the research?
Image Attributions
Figure 2.2. This Might Be Me in a Few Years by Frank Kovalchek is used under a CC BY 2.0 license.
Figure 2.3. Used under a CC BY-NC-SA 4.0 license.
Figure 2.4. Used under a CC BY-NC-SA 4.0 license.
References
Anderson, C. A., & Dill, K. E. (2000). Video games and aggressive thoughts, feelings, and behavior in the laboratory and in life. Journal of Personality and Social Psychology, 78(4), 772–790.
Damasio, H., Grabowski, T., Frank, R., Galaburda, A. M., Damasio, A. R., Cacioppo, J. T., & Berntson, G. G. (2005). The return of Phineas Gage: Clues about the brain from the skull of a famous patient. In Social neuroscience: Key readings (pp. 21–28). New York, NY: Psychology Press.
Freud, S. (1909/1964). Analysis of phobia in a five-year-old boy. In E. A. Southwell & M. Merbaum (Eds.), Personality: Readings in theory and research (pp. 3–32). Belmont, CA: Wadsworth. (Original work published 1909)
Henrich, J., Heine, S. J., & Norenzaya, A. (2010). The weirdest people in the world? Behavioral and Brain Sciences, 33, 61–83.
Kotowicz, Z. (2007). The strange case of Phineas Gage. History of the Human Sciences, 20(1), 115–131.
Rokeach, M. (1964). The three Christs of Ypsilanti: A psychological study. New York, NY: Knopf.
Stangor, C. (2011). Research methods for the behavioral sciences (4th ed.). Mountain View, CA: Cengage.
